What is Linear Inequalities?
Linear inequalities are mathematical expressions involving linear functions that express a relationship between two variables and indicate the relative positions of values on a number line. A linear inequality is similar to a linear equation, but instead of equating two expressions, it asserts that one expression is greater than (>), less than (<), greater than or equal to (≥), or less than or equal (≤) to another.
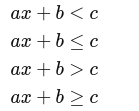
The general form of a linear inequality in one variable x is:

Here, a, b, and c are constants, and x is the variable. The inequality symbol (<, ≤, >, or ≥) indicates the nature of the inequality.
For example, the inequality 3x – 5 < 7 states that the expression 3x – 5 is less than 7. Solving this inequality would involve finding the range of values for xx that satisfy the inequality.
What are Linear Inequalities in Two Variables?
Linear inequalities in two variables are mathematical expressions that involve a pair of variables, often denoted as x and y, and describe a region in the coordinate plane where the ordered pairs (x, y) satisfy the inequality. The general form of a linear inequality in two variables is:
- ax+ by < c
- ax + by ≤ c
- ax + by > c
- ax + by ≥ c
Here, a, b, and c are constants, and x and y are the variables. The inequality symbol (<, ≤, >, or ≥) indicates the nature of the inequality.
For example, the inequality 2x + 3y ≤6 represents a region in the coordinate plane where all the points (x, y) that satisfy the inequality lie below or on the line 2x + 3y = 6.
The solution to a system of linear inequalities in two variables is the set of all points that simultaneously satisfy all the inequalities. This solution region is often represented graphically on the coordinate plane by shading the area that satisfies all the given inequalities.
The process of solving linear inequalities in two variables involves graphing the corresponding linear equations, choosing a test point, testing the inequality with the chosen point, and then shading the appropriate region based on the test results.
These types of inequalities are commonly used in optimization problems, where constraints are modeled using inequalities, and the goal is to find the set of values that maximize or minimize a certain objective function.
How to Solve Linear Inequalities in Two Variables?
Solving linear inequalities in two variables involves finding the region in the coordinate plane where the solutions to the inequality lie. Here are the general steps to solve a system of linear inequalities in two variables:
Step 2: Graph the Corresponding Linear Equations:
Treat each inequality as an equation and graph the corresponding linear equation. This will give you the boundary lines of the solution regions.
Step 3: Identify the Region of Intersection:
For a system of inequalities, identify the region where the shaded regions (solutions) overlap. This is the region that satisfies all the inequalities simultaneously.
Step 4: Choose a Test Point:
Select a test point within one of the shaded regions. The origin (0,0) is often a convenient choice.
Step 5: Test the Chosen Point:
Substitute the coordinates of the test point into each inequality. If the inequality is true for the chosen point, then that shaded region is part of the solution. If false, then the opposite region is part of the solution.
Step 6: Draw the Shading:
Based on the test results, shade the region that satisfies all the inequalities. If the inequality is strict (< or >), use a dashed line for the boundary. If it is non-strict (≤ or ≥), use a solid line for the boundary.
Step 7: Express the Solution:
Express the solution set using interval notation or set notation. For example,}(x,y)∈{(x,y)∣x>0 and y≤2}.